Show Photo
This screen has three purposes :
1. Have a look at your photo and see where the variables and comparaison stars are situated
2. Inspect if your stars are burnt out for the exposure time of your photo.
3. See what is in the FitsHeader of the photo
How to Proceed in AstroPie ???
First of all, a Star Group has to be chosen via the Step 2 "Choose Star Group to be analysed" on the Dashboard.
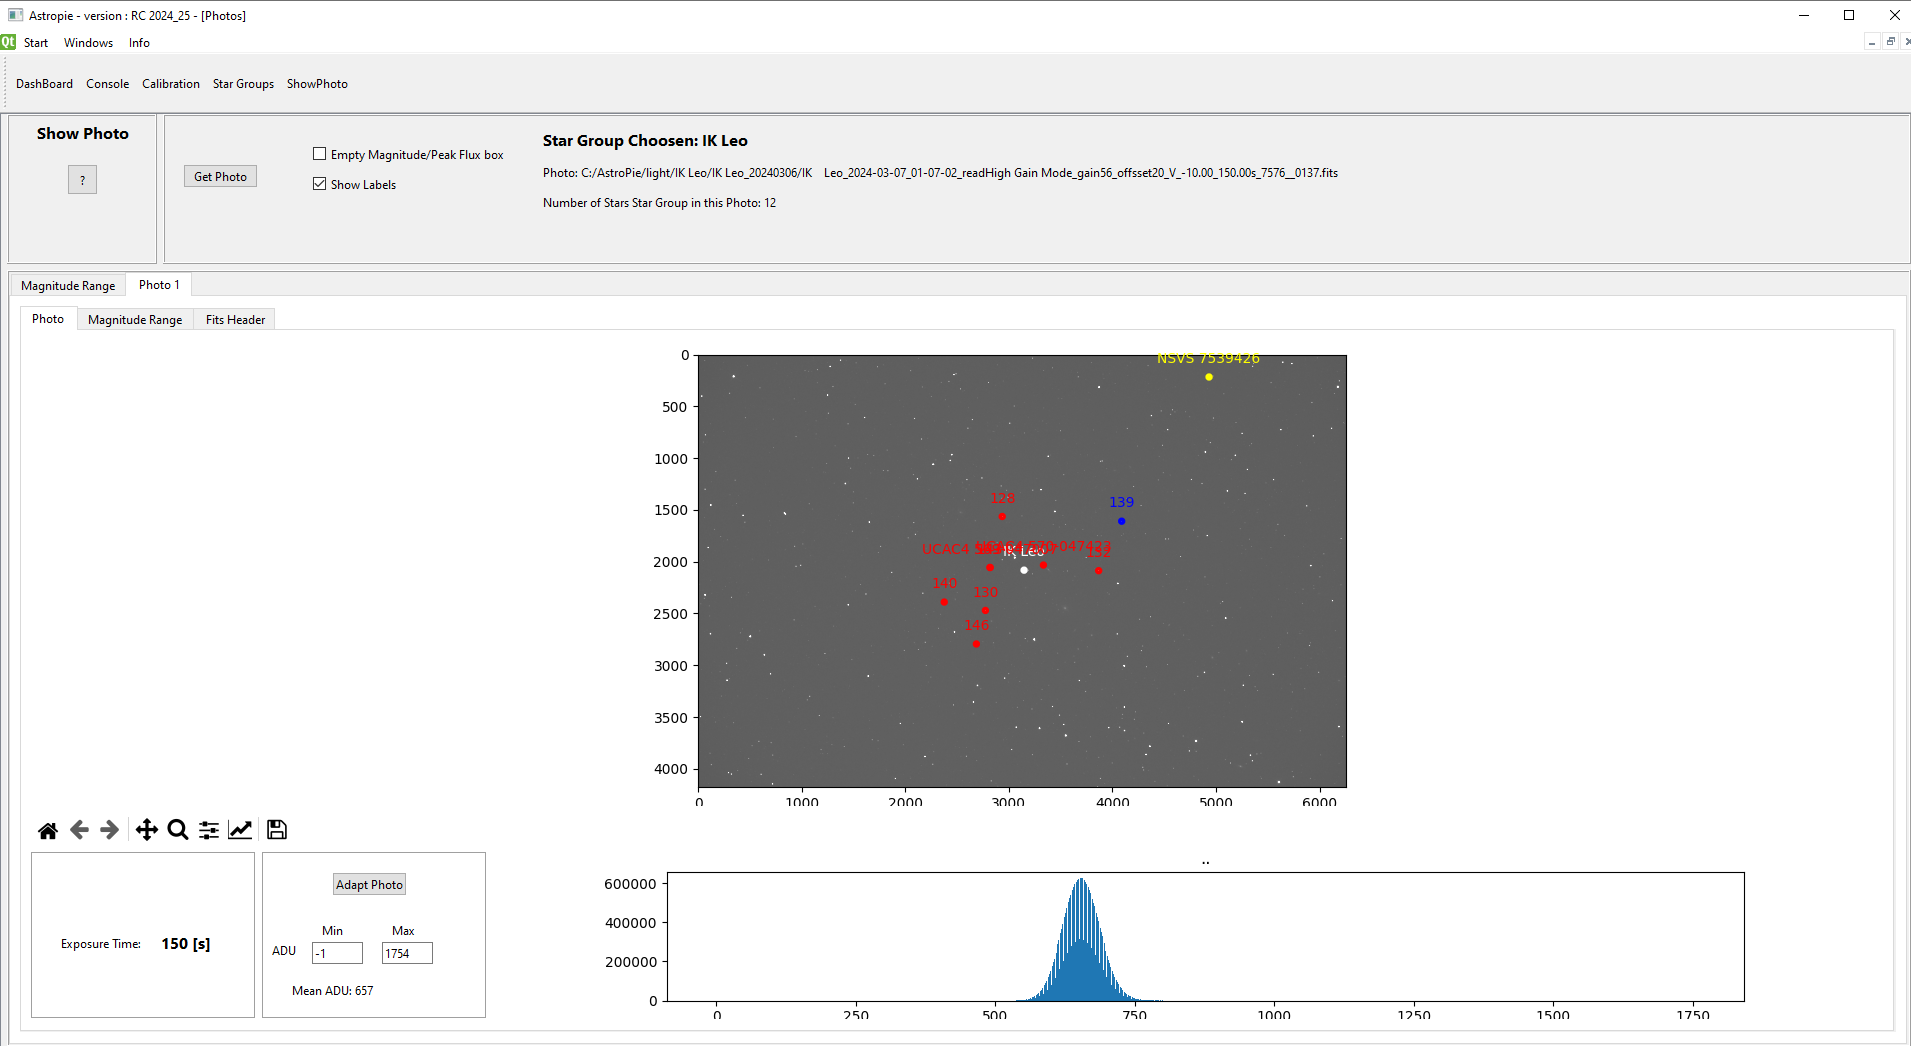
Then the button "Get Photo" can be used to get a photo and have it analysed.
The Star Group, the name of the photo and the number of stars from the Star Group will be shown in the first part of the screen.
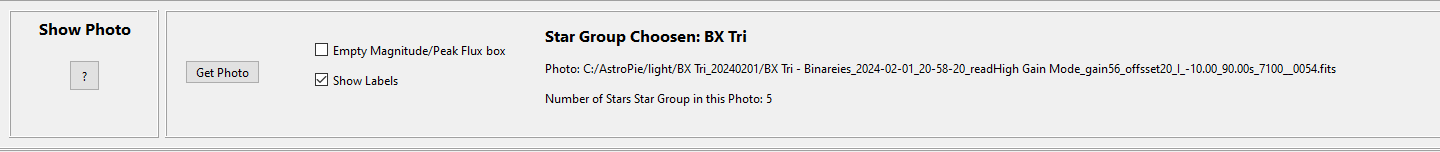
If the check box "Show label" is checked, the name of the stars will be shown on the photo and the magnitude range graphs.
The meaning of the check box "Empty Magnitude / Peak flux box" remains a secret, for now.
A second, a third, a ... photo can be called via the button "Get Photo".
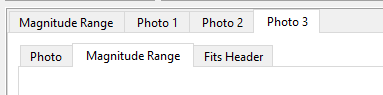
A second tab "Photo 2" appears with the second photo, the stars, the histogram and the Magnitude Range (see further)

Photo Navigation ?
Under the photo the Photo Navigation box is visible.
You can zoom in, zoom out, shift left/right/up/down, return to complete photo, save and some things more.
Better to try than to explain here.

Histogram ?
A histogram of the photo is shown.
Change the Minimum en Maximum ADU values, and via the button "Adapt Photo" the boundaries of the histogram will be changed:
More importantly, in this way the photo will be shown darker or lighter.
Try !

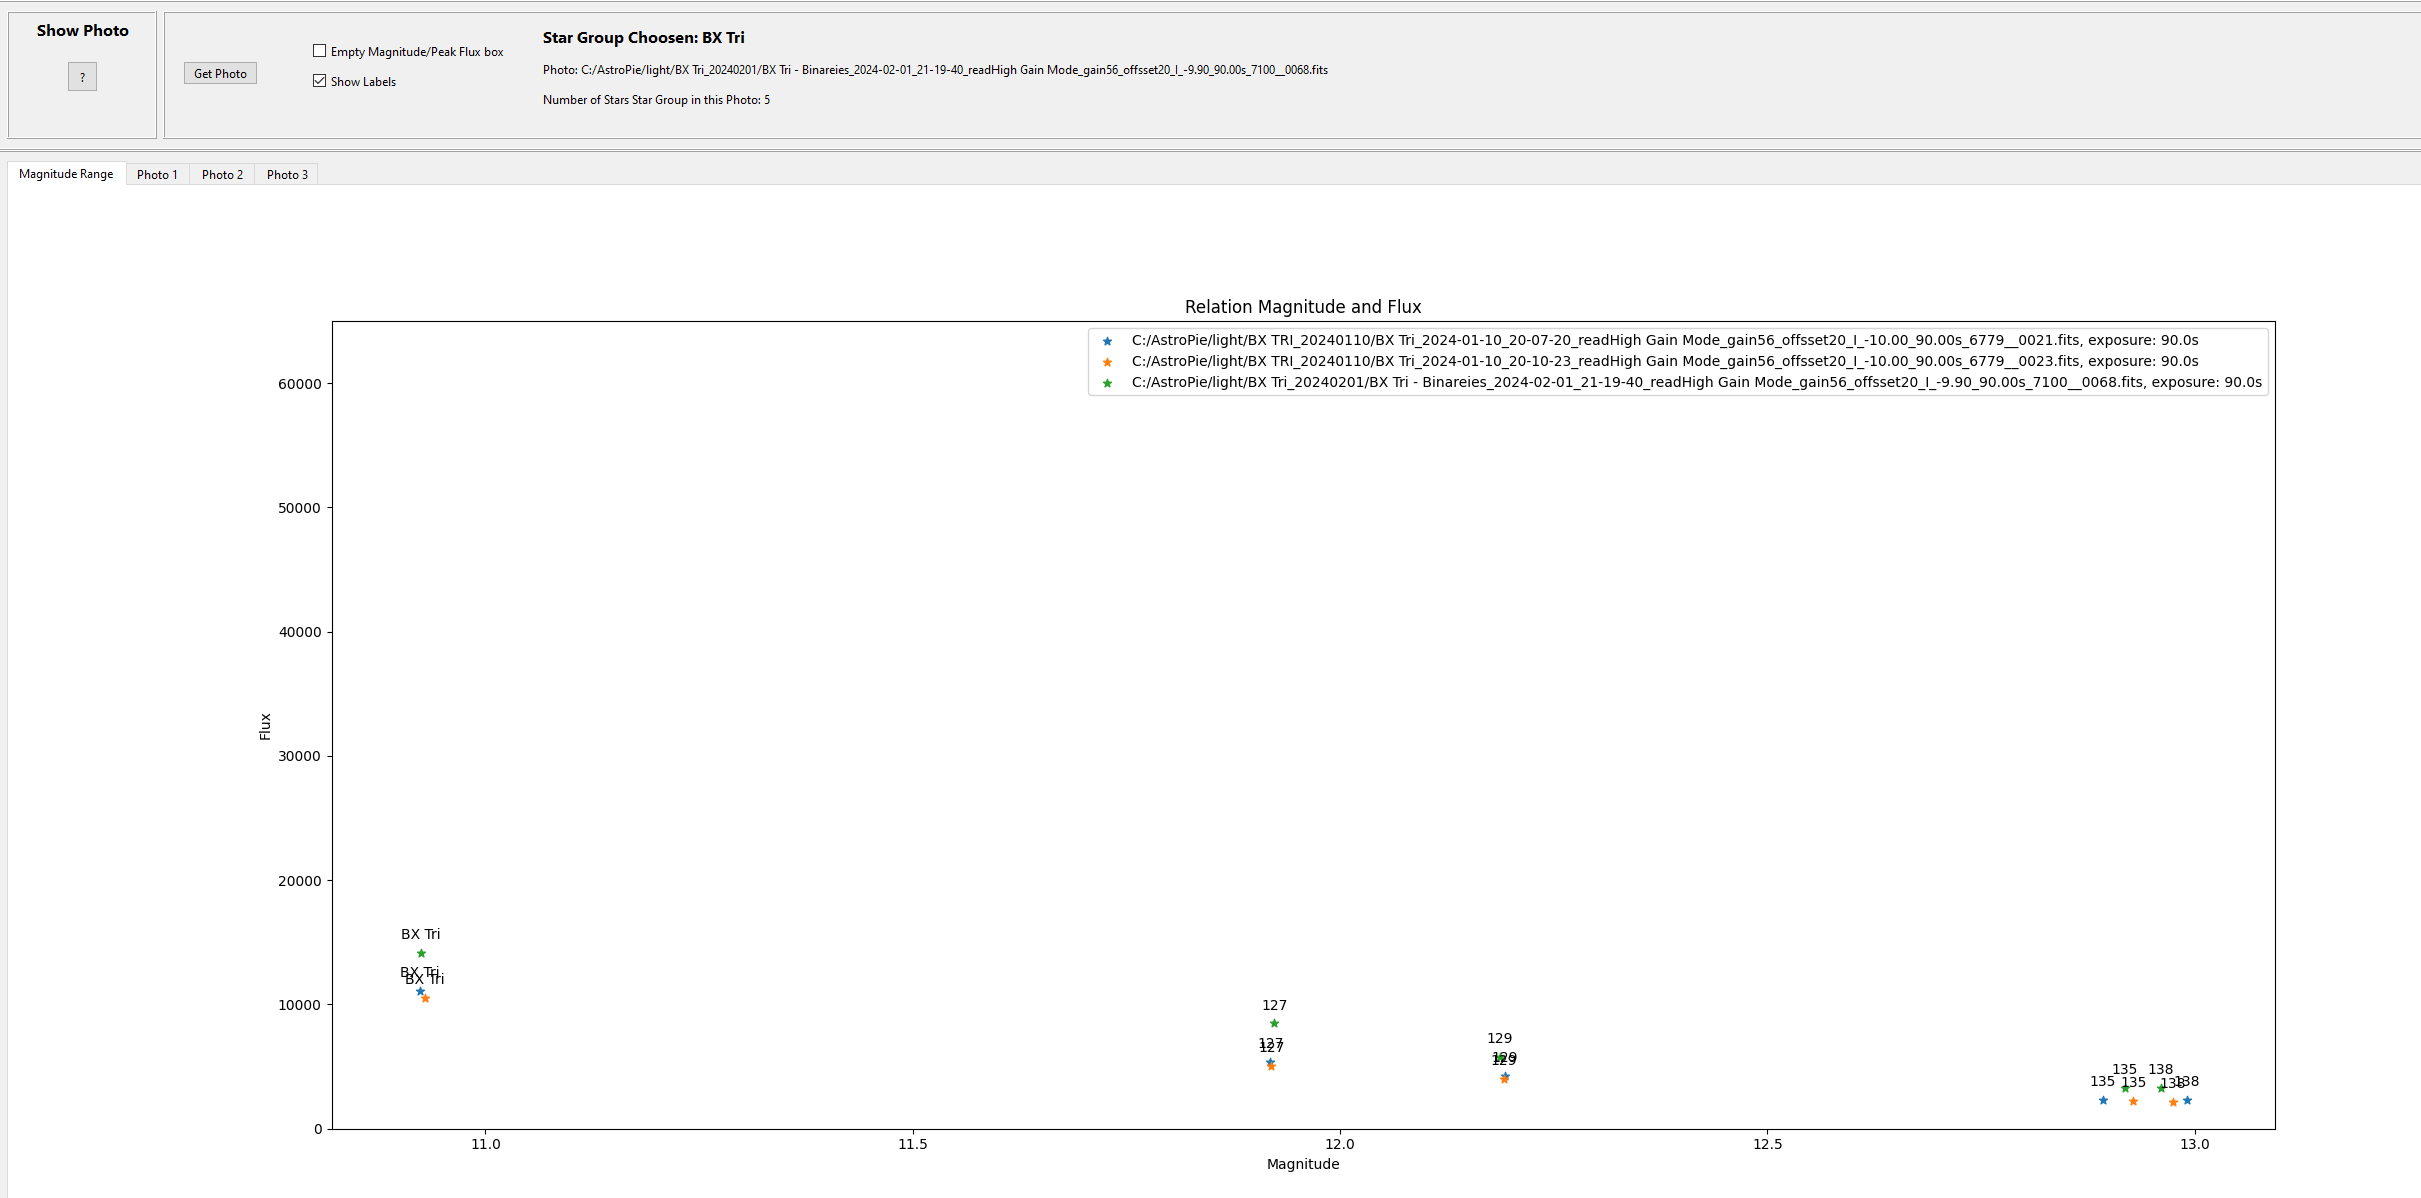
Magnitude Range
The purpose of this graph is to show how much ADU is counted in the photo for each star in the star group.
In this way you can estimate if for this exposure time the stars will be clipped at what magnitude, thus, at what magnitude no decent photometry will be possible. Of course, if the ADU is too low (if the exposure time is too short), the signal-to-noise ratio will be too low, and the uncertainty (error) on the magnitude of th photo will be high.
There are two Magnitude Range tabs : one inside the tab "Photo < nr >", and one in front of all the photo's :
Let's have look at the one in front of all the photo's. In the mean time I've loaded three different photo's, they are shown in the legend.
In this graph all the stars from the star group are shown. In this case we see that our variable has an ADU of 10000 à 15000, and that the comparison stars of magnitude 13 have about 5000. I could have exposed a bit longer.
If you would have checked the box "Empty Magnitude/Peak flux" and called another photo, the existing content of the graph would have been emptied (for a better overview)
The magnitude range graph inside the "Photo < nr >" tab only contains the data for that specific photo
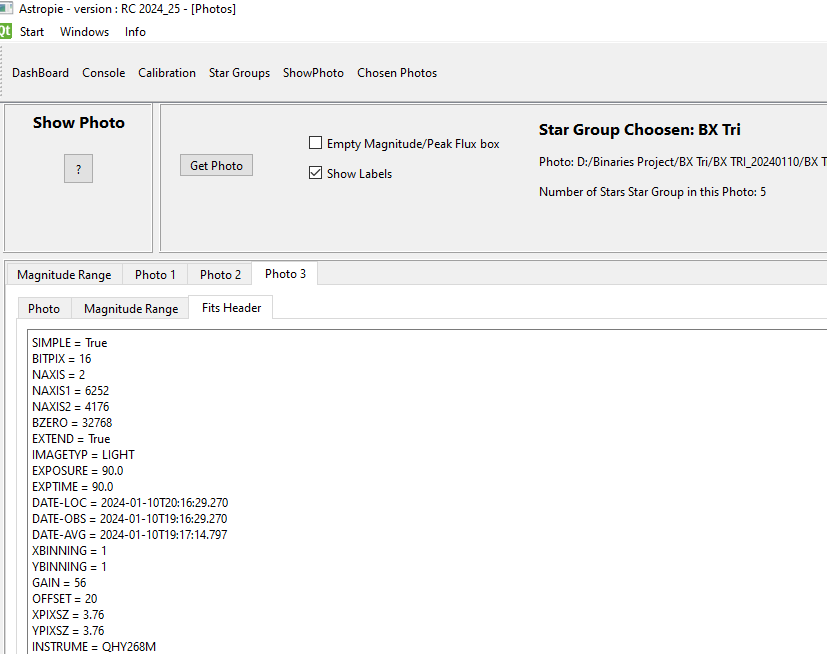
Fits Header
A third tab, called "FitsHeader", shows the details of the photo as they are noted in its fits header (yes).